A user friendly-way
for solving complex decisions
IMPROVE YOUR VALUE-CHAIN
STEP BY STEP
of your process or value-chain
of the statistical analysis with clear infographics
with interactive bottom-up analysis
with interactive top-down analysis
Quickly gather data
with clear & well-structured questions
that enable you to collect all the necessary information
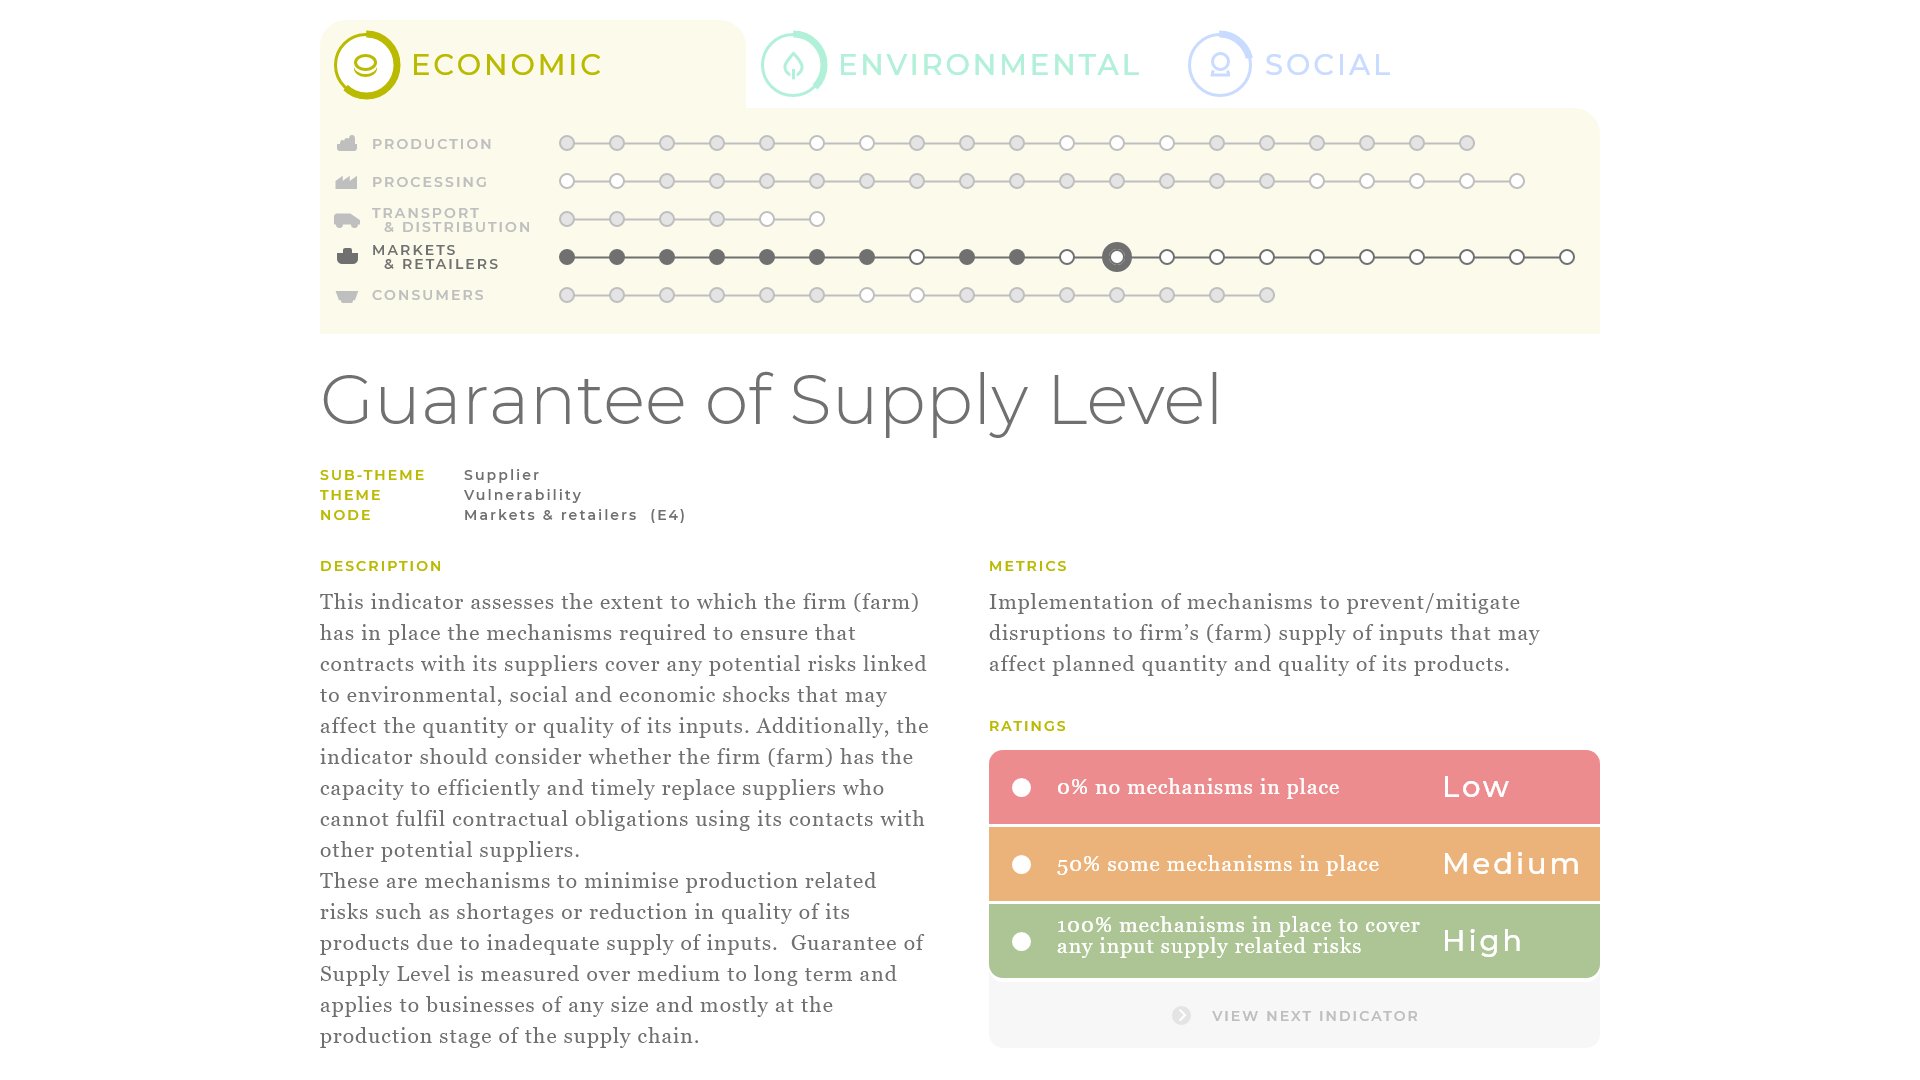
Clear visual hierarchy
with big contrasts between categories
guides your attention to the most important information
Increased text readability
with decreased line width and increased line spacing
enables you to comfortably read through descriptions
Visualized map of decision space
with focused active indicator and marked already done ones
provides you with a sense of location every step of the way
Straight-forward rankings
with bright colors & clear descriptions
enable you to easily evaluate each step of the process
Evaluate the results visually
with colorful infographics
that enable you to gather insights into otherwise hard to comprehend data
Visual representation of complex results
with colorful charts
enables you to grasp the data situation quickly
Detailed analysis of specific aspects
with colored icons
helps you get a deeper understanding of analyzed process
Clear explanations of the charts
with provided additional information
ensures that you interpret the results correctly
Simple ways of testing different scenarios
with buttons offering possible directions
guides you through the process of additional analysis
Review effects of changes
in advance with interactive bottom-up analysis
that enable you to test different scenarios without ever performing them live but still see the results
Effortless insights of the consequences of your choices
with clearly marked before and after states
let’s you know which process modifications are worth following through
Emphasized consequences of possible scenario modifications
with a list of resulting changes
provide you with a more accurate understanding of each scenario
Wide variety of possible modifications
with structured display of the inditator’s hierarchy
enables you to fine tune the investigated scenario
Easy way to save scenarios
with a button under each chart
permits you to later compare all your favorite scenarios
Discover the best solutions
Easy way to generate scenarios
with interactive elements
guiding you to test different results
Automatic generation of possible scenarios
with list of possible options
provides you with means of analyzing a huge number of different scenarios
Detailed view of specific aspects
with colorful icons of different nodes
enables you to further inspect each generated variant
Simple way to save scenarios
facilitates later comparison between your favorite scenarios
Ready to start?